
By Brian Le
A risk report is a product we deliver to customers that highlights observed risks in a facility with the objective is to help reduce potential losses from injuries. It is a method we use to communicate the risks we discover in the video data tied to insights from our data science team and safety recommendations from our loss control team to the customer.
The risk report generation process has numerous steps starting from data collection and ingestion to data analysis and video review. We collect hours of video data, typically within a 2 week period, from strategically selected cameras that provide an general overview of the activity and risks within the facility. From there, we ingest the video data through a pipeline where we perform object tracking and event detection using computer vision models that capture forklifts, workers and safety events detected into bounding boxes and collected into our database. Using this kind of data allows our data science team to build powerful analyses, such as time series heat maps on activity and risks.
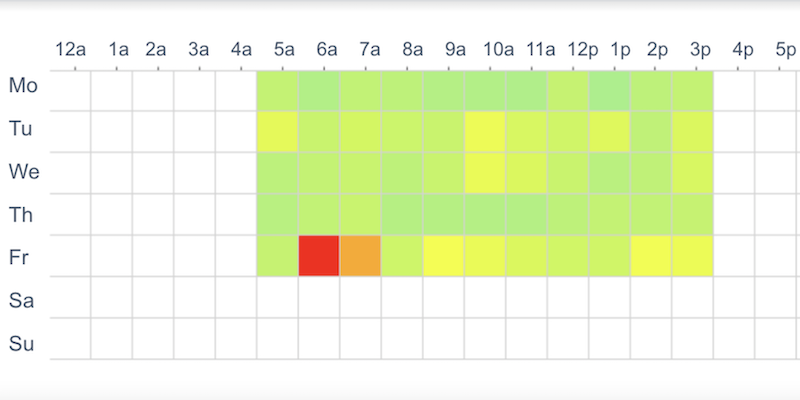
Time Series Heat Map of Ergonomic Activity
In the heat map above, we are observing ergonomic activity within a 2 week report period for a single customer. Each cell represents a single hour period for a given day of the week as event counts normalized by number of workers. From the chart, we can observe that Fridays from 6am to 7am contain the most ergonomic risk. During this time, workers are engaging in very frequent ergonomic activities in comparison to the rest of the periods, which is a leading indicator of ergonomic injuries such as muscle strains. To generate the heat map, we group the data by time of the day and day of the week and then plot the period counts relative to their density levels.
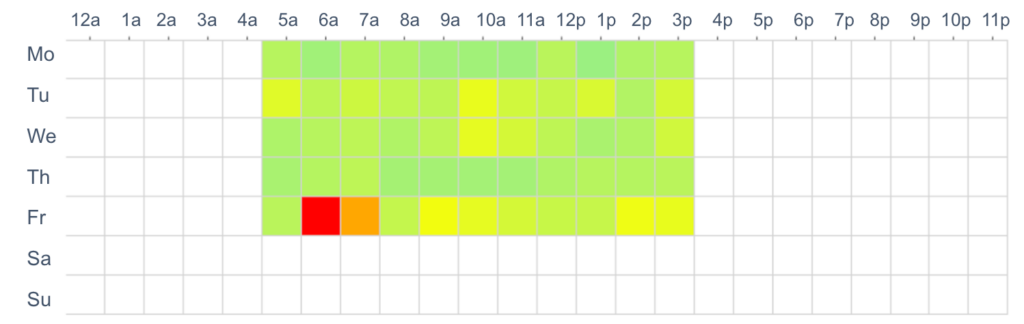
Time Series Heat Map of Worker Activity
The difference between this heat map and the previous one is the metric represented in each cell. Here we are observing total worker hours, which is the total duration of each worker detected in every camera. From the chart, we can observe that work tends to ramp up after the first hour, slow down before lunch, pick back up and then drop at the last hour of the day. Intuitively, this makes sense as teams usually initiate their work day with a meeting and then slow down productivity after hours of working in anticipation of clocking out for lunch or the day. We also find that Fridays are the slowest day in the week, but have the highest ergonomic risk as stated from the previous heat map. Ultimately, these charts help our team and the customer understand peak hours of activity and risk to focus their attention to when looking to reduce risk.
After a risk report is completed, our team delivers the report to the customer in a virtual meeting where we go through the report as a presentation. During this process, we ensure that the customer understands the content of the report and most importantly, the insights and recommendations we provide. In order for the customer to take advantage and reduce risk in potential losses, they should consider the recommendations and how to execute on them. This may include additional training, purchasing equipment, improving processes, etc. After their first risk report is delivered, we allow the customer time to make the changes and collect data at a later period, typically a few months later to ensure that we capture the changes. Our team then runs a second risk report with a different structure that tracks any change in the metrics highlighted in the report to gather and deliver insights on their progress.